Standard Deviation Calculator
Population and sample standard deviation from a list of numbers.
Standard deviation measures how spread out a set of numbers is around its average. This calculator accepts a list of values, separated by commas or spaces, and computes the mean, variance, and standard deviation using either the population formula (dividing by n) or the sample formula (dividing by n − 1), depending on what your data represents.
A small standard deviation means most values cluster tightly around the mean; a large one means the data is spread widely, with some values far above or below average. This single number underpins quality control, test-score analysis, financial risk measurement, and most of inferential statistics.
On this page
Step-by-Step: The Standard Deviation Formula
First, calculate the mean (average) of all values. Second, find each value’s deviation from the mean and square it (squaring removes negative signs and emphasises larger deviations). Third, average those squared deviations to get the variance. Finally, take the square root of variance to return to the original units — that result is the standard deviation.
Population standard deviation: σ = √(Σ(x − μ)² ÷ N). Sample standard deviation: s = √(Σ(x − x̄)² ÷ (n − 1)). The only difference is the denominator — N (the full population size) versus n − 1 (one less than the sample size).
Sample vs Population: Which Should You Use?
Use the population formula only when your data set represents every member of the group you care about — for example, the test scores of every student in one specific class, with no intention to generalise beyond that class.
Use the sample formula whenever your data is a subset drawn from a larger group you want to make inferences about — for example, surveying 200 customers to estimate satisfaction across your entire customer base. Dividing by n − 1 (known as Bessel’s correction) corrects a slight downward bias that would otherwise make sample variance systematically underestimate the true population variance.
A Worked Example
Take the data set 4, 8, 6, 5, 3, 7. The mean is (4+8+6+5+3+7) ÷ 6 = 33 ÷ 6 = 5.5. The squared deviations from the mean are 2.25, 6.25, 0.25, 0.25, 6.25, and 2.25, which sum to 17.5.
For a population, variance = 17.5 ÷ 6 ≈ 2.92, giving σ ≈ 1.71. For a sample, variance = 17.5 ÷ 5 = 3.5, giving s ≈ 1.87. Notice the sample estimate is slightly larger, which reflects the correction for using an incomplete data set to estimate a larger population’s spread.
Interpreting the Result
Standard deviation carries the same units as your original data — dollars, seconds, kilograms — which makes it easier to interpret than variance, whose units are squared and often meaningless on their own (like "dollars squared").
To compare spread across two data sets with very different scales (for example, comparing income variability to age variability), use the coefficient of variation: CV = (standard deviation ÷ mean) × 100%, which expresses spread as a percentage of the average rather than in raw units.
Standard Deviation and the Normal Distribution
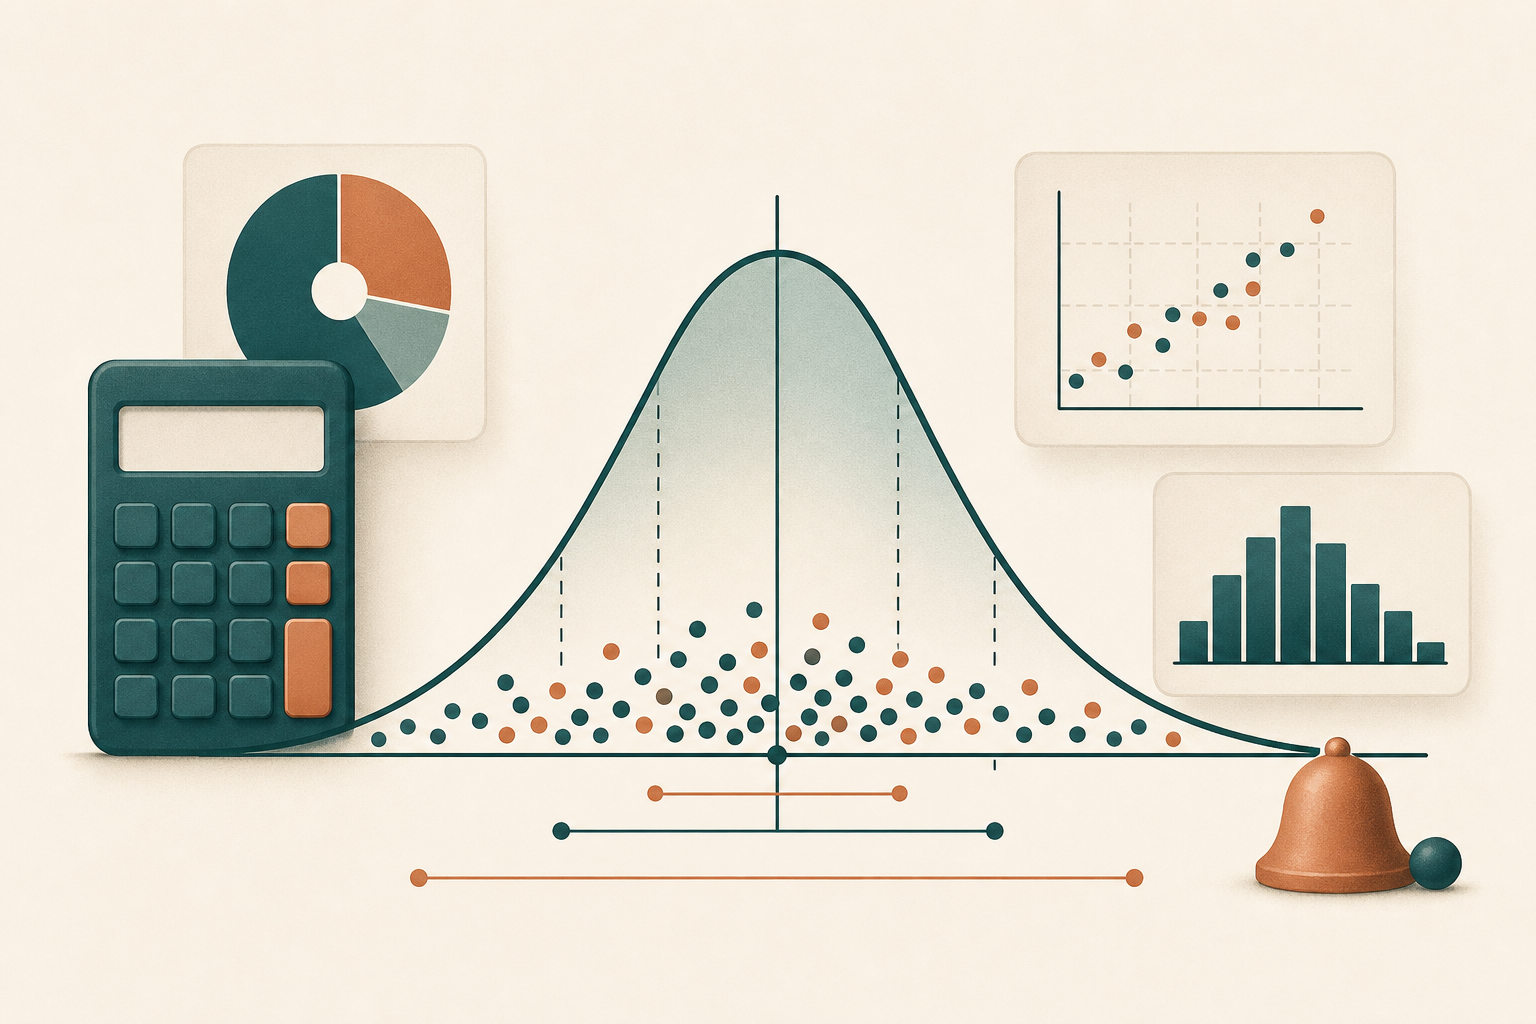
For data that follows a roughly bell-shaped (normal) distribution, standard deviation has a particularly useful interpretation known as the empirical rule: about 68% of values fall within one standard deviation of the mean, about 95% fall within two standard deviations, and about 99.7% fall within three.
This rule underlies how quality-control charts flag unusual manufacturing measurements, how standardized test scores get converted into percentiles, and how financial analysts describe "how unusual" a market move was — a return several standard deviations from the average is, by definition, a rare event under a normal-distribution assumption, though real-world data does not always follow that assumption perfectly.
If you need the coefficient of variation — standard deviation divided by the mean, expressed as a percent — the Percentage Calculator finishes that last step after you have the two raw numbers from this page, and the Scientific Calculator helps with square roots or logs when you are checking intermediate variance math by hand.